Detecting Bugs in Code - 7 Debugging Tools for Faster Operation

When writing code, it’s easy to make mistakes or errors. They can happen to anyone, at any stage of work. What to do if our code result doesn’t match our expectations or we aren’t sure what data are processed at particular steps? In such a situation, we can spend hours looking for a solution or use a debugger to make our work easier.
What is debugging?
Debugger, unfortunately, isn’t a tool that will fix our code and find all the errors automatically. It requires our participation, in the form of dividing our code into individual parts, crucial in finding the searched data. Here debugging tools come to aid. They allow us to run the code step by step and verify if it operates as intended. We can carry out this process at any time. However, it’s important to apply it when we aren’t sure where unexpected values of variables, results of functions, or results of other unpredicted behaviors come from.
Debugging tools for PHP
There are many tools available in PHP to make debugging and checking code easier. When an application is running in debug mode, or when the logging level is set to debug, debugger messages will be found in logs, the console, or in the graphical interpretation.
Xdebug
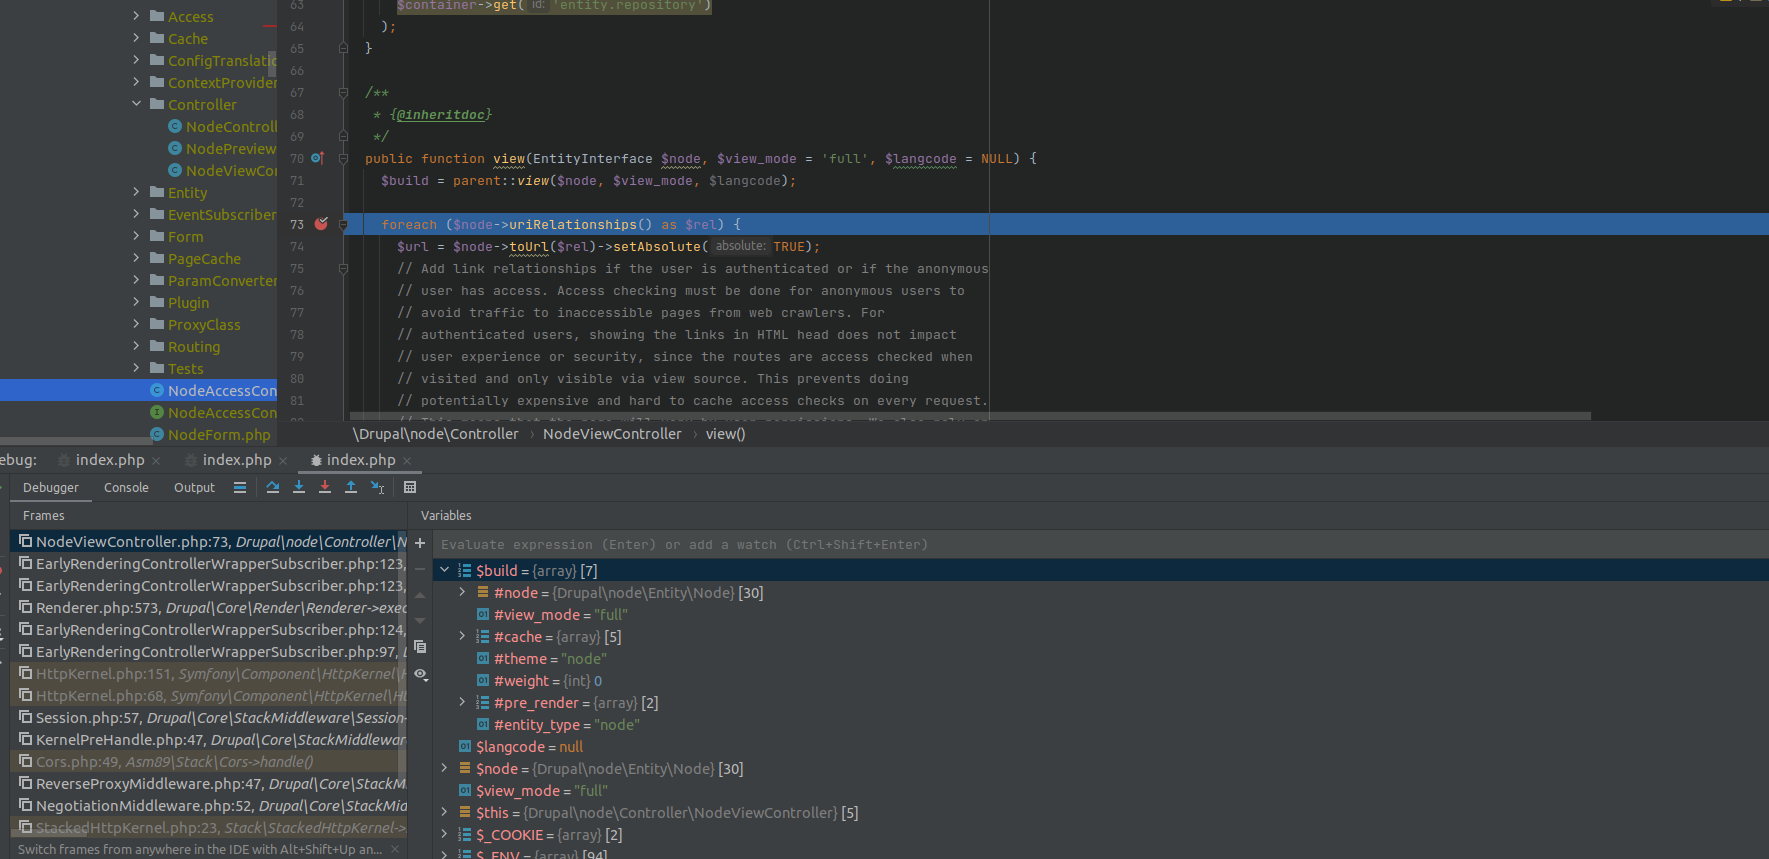
Xdebug is one of the most popular debuggers for PHP. It enables us to add breakpoints at any point in your code and stop its execution at any time. Setting a breakpoint allows us to download the status of the application and the values of variables.
Xdebug is fully compatible with PHPstorm, and its integration is very simple.
Xdebug helper in Chrome is a handy extension. It adds a browser cookie, which allows communication between the browser and the editor, and more control over the debugging process and the current Xdebug mode setting.
Whoops
This is a fairly small and simple library that allows for more control over the code. It supports, among others, JSON, AJAX, and XML. Once integrated into a given project, the tool returns a frame from what is happening in the background of the application. Additionally, in the case of Laravel 4, Whoops is added in the core, which streamlines its use.
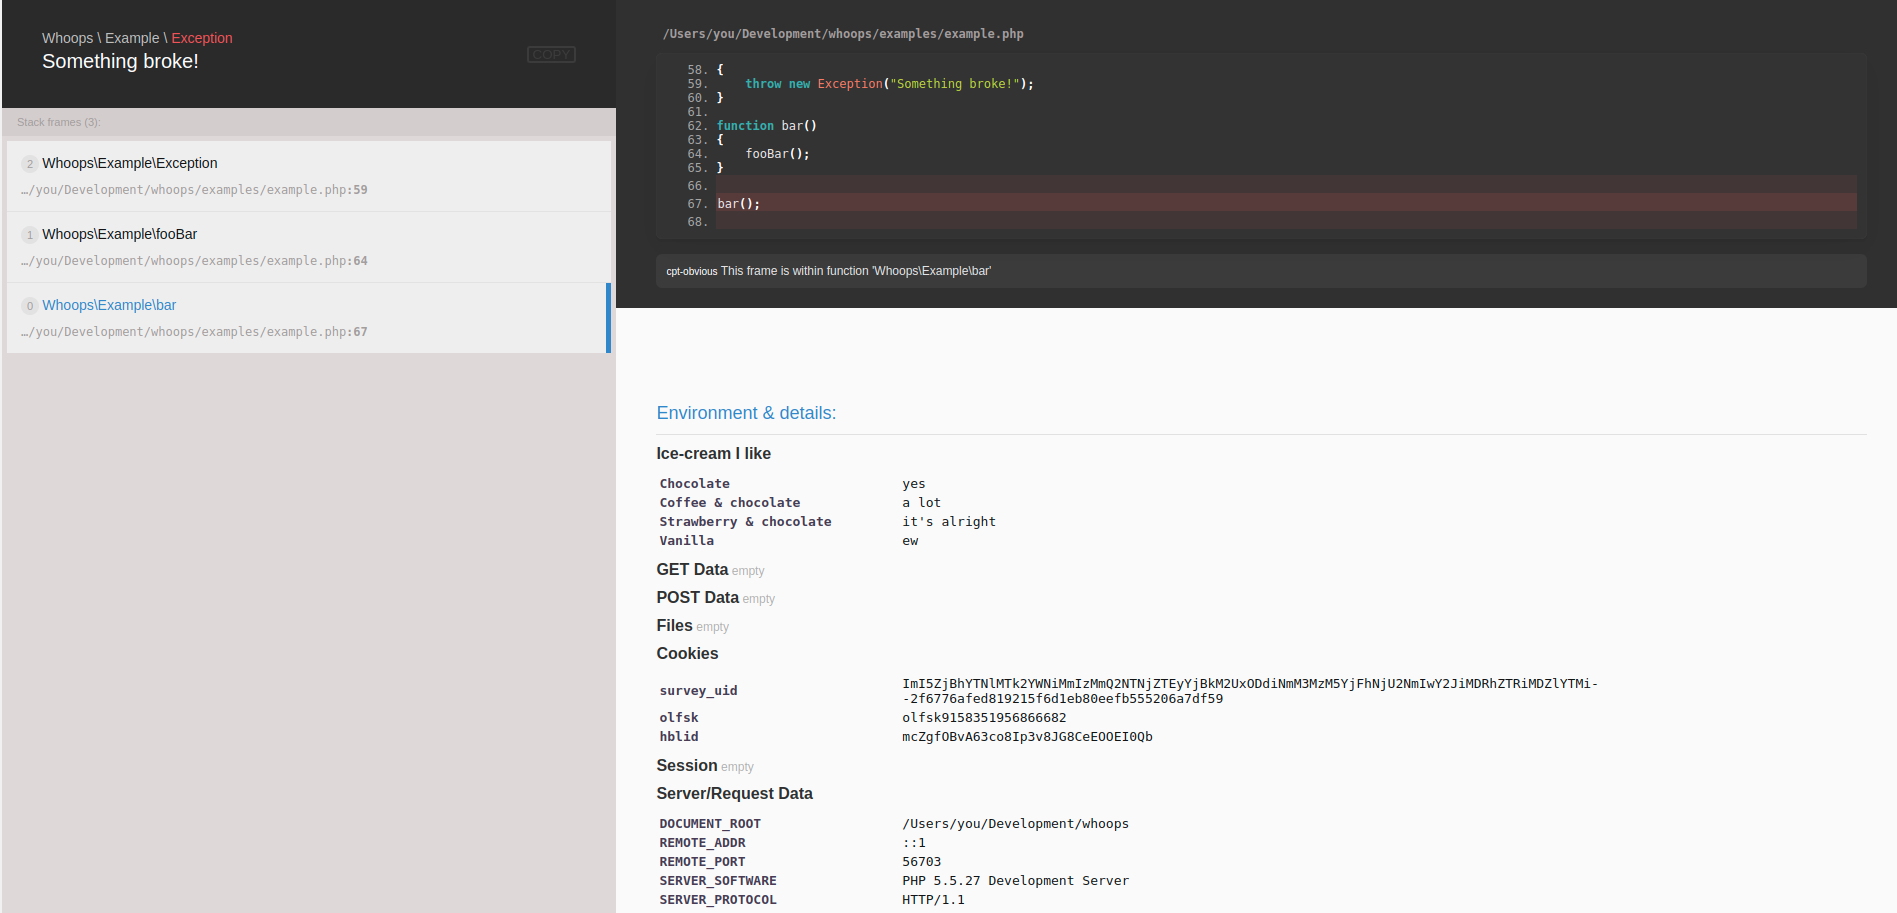
In the Whoops demo, we can test how this tool works.
PHP DebugBar
DebugBar is very easy to integrate into existing projects. It displays data from any part of the code in a simple and readable form. Once we’ve added it to our project, we simply add a debugger call in your code, along with the checked value or text.
$debugbar["messages"]->addMessage("hello world!");The called method will return the accepted argument in the browser's developer tools, where a tab with all the necessary debugger data will appear.
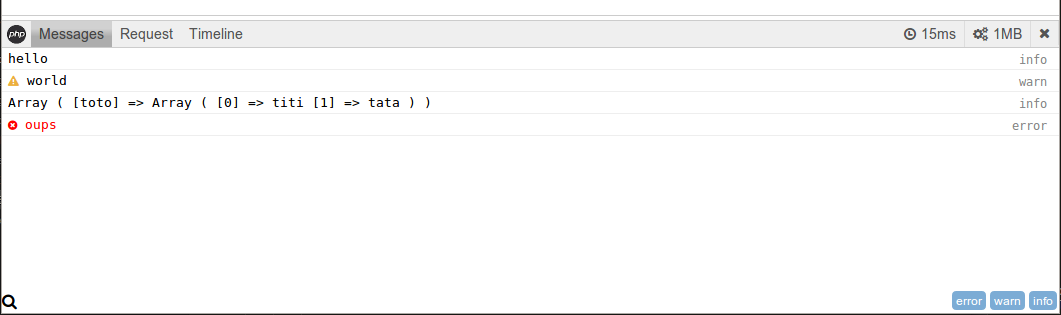
Source: GitHub PHP DebugBar
Various tools for debugging
In addition to the tools that are useful when coding in PHP, there are also many others that make your work easier in other cases. Errors happen just as often on the frontend as well as on the backend. What to do when we create an application based on ready-made designs and we aren’t sure where the final result of the code comes from? Let’s take a look at some other handy tools.
Visual Studio Remote Debugger
What are the advantages of remote debugging? This is useful when the debugged application has been run on an environment other than the local one. Remote debugging is enabled by an interesting tool for those who are familiar with Visual Studio. Remote Debugger allows us to check for errors from anywhere we have access to the target environment.
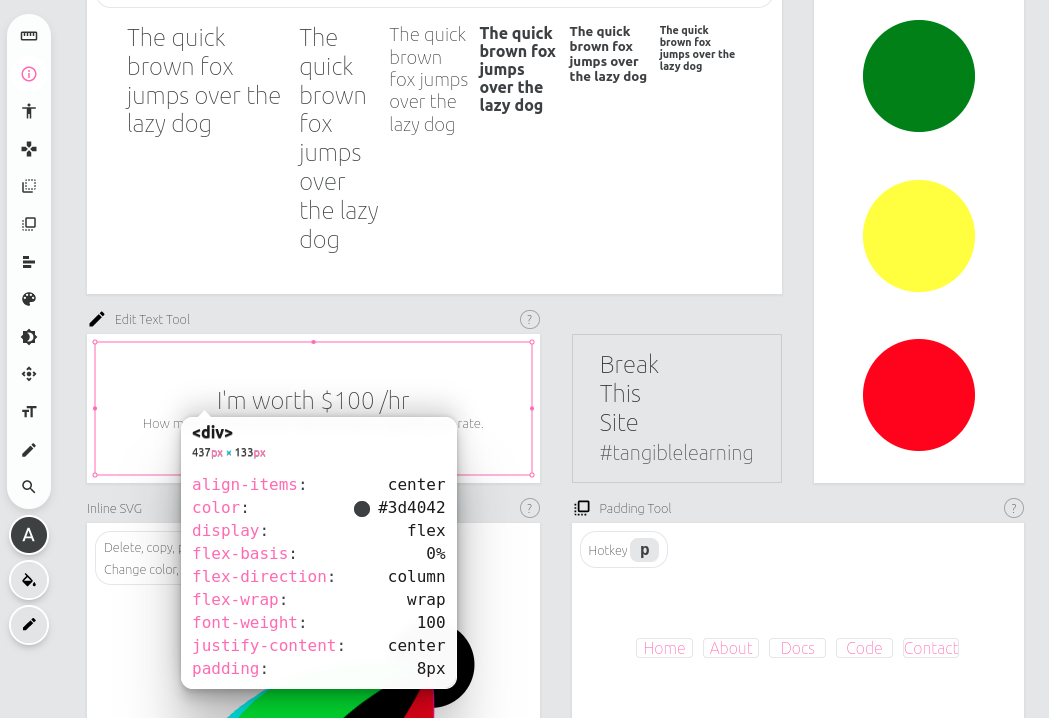
VisBug
This is a browser plugin available for Chrome, Firefox, Safari, and Edge. VisBug provides a simple and clear way to examine individual elements on a website and significantly speeds up debugging of the frontend. In addition to checking tag type, text size, margins, element width, and many other styles through graphical representation, it allows us to edit them in real-time and check the effects quickly.
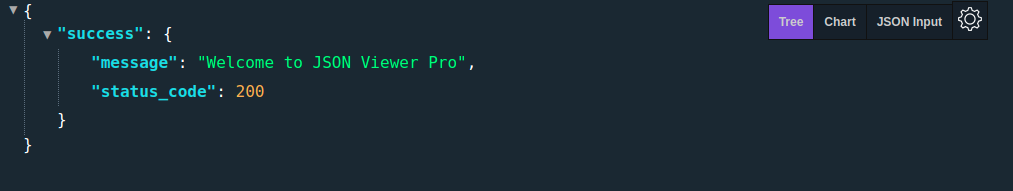
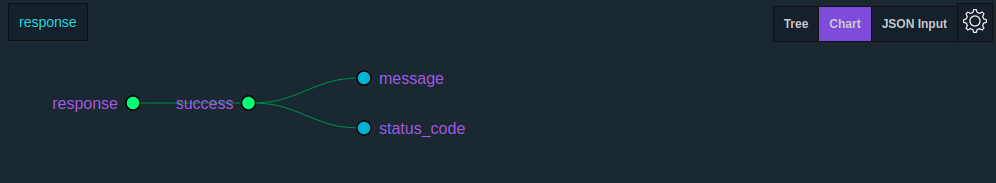
JSON Viewer Pro
This is another browser add-on, this time to help us work with JSON. It allows editing JSON from the API and its graphical representation. Additionally, JSON Viewer Pro performs JSON validation, which helps us find errors.
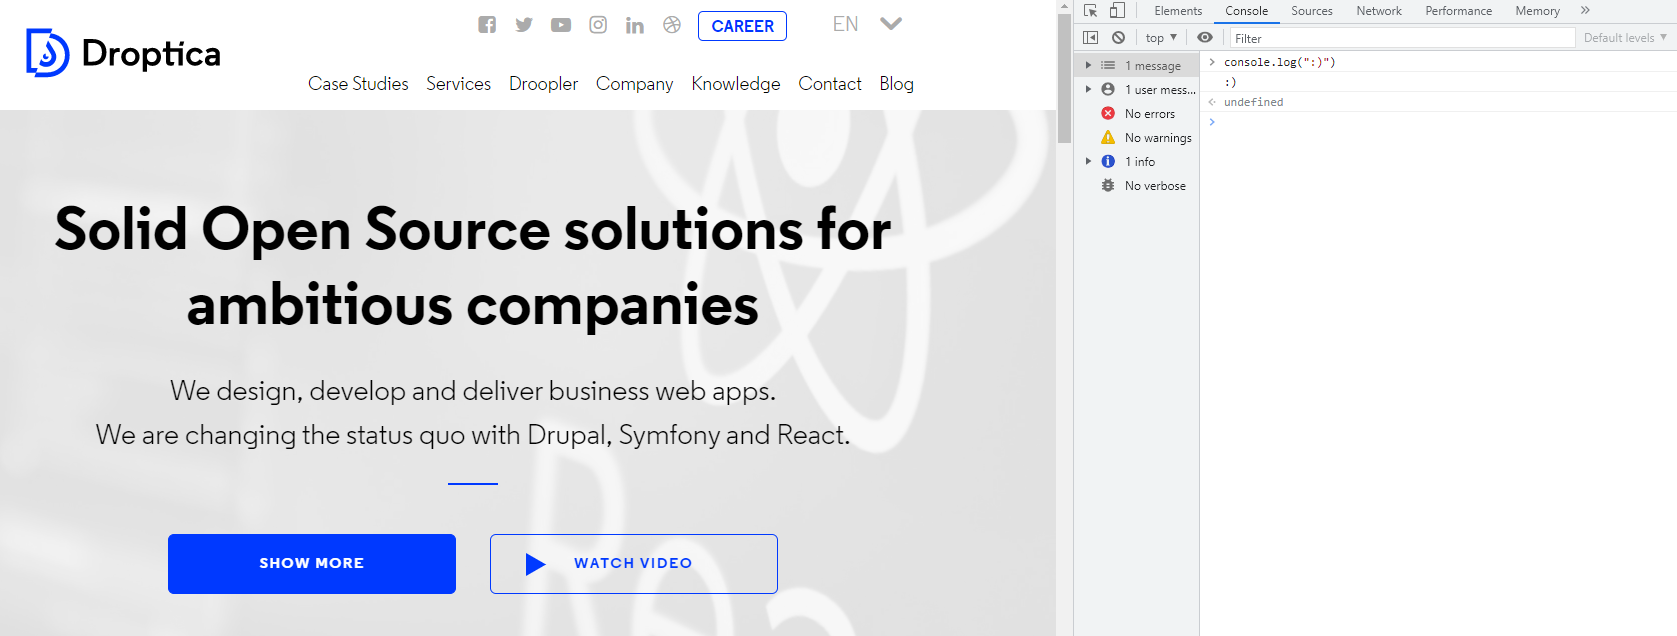
Developer tools
Sometimes the simplest solutions are the best ones. This is also the case for debugging the frontend using tools built into the browser. Almost every modern browser has them as standard. Such tools offer many possibilities, e.g. allowing real-time editing of HTML, CSS, and JS. In the case of JS, we have the ability to execute the code and set breakpoints to help us find errors.
Debugging tools - summary
Debugging tools are essential when we want to figure out what went wrong. They speed up our work and make it easier to find errors when we have no idea what is going on in the background of our application.
As specialists in custom software development, we’ll be happy to help you choose the right solutions to detect errors in your code or we’ll analyze its condition ourselves and suggest improvements.